Introduction
ClangIR (CIR) has been upstreamed
incrementally since 2024. In February 2026, the original incubator repository was
archived, and development moved to llvm-project. The
incubator’s experimental lifetime checker,
cir-lifetime-check, has not been upstreamed yet. The
prototype implementation discussed here is available on the cir-lifetime-check
branch.
The lifetime checker combines CIR’s explicit operations and control flow with C++ semantic information preserved from Clang’s AST. This gives the analysis an IR for tracking program state together with the source-level facts needed to interpret C++ operations.
Use-after-move detection was one of my last additions to the
incubator checker. Such bugs can occur when code uses a moved-from
object while assuming that it still holds its original value. A later
operation’s validity depends on the type’s post-move guarantees and the
operation’s preconditions. For example, standard-library
objects generally remain valid after a move, although their state
may be unspecified. clang-tidy already provides a check for detecting
potential use-after-move bugs: bugprone-use-after-move.
Checks such as bugprone-use-after-move can become very
expensive to run on large, complex C++ projects. I believe a checker
built on CIR can offer a useful alternative, and this article tests that
expectation.
I compare the
CIR lifetime checker with the original clang-tidy
bugprone-use-after-move check, using the Clang source tree
as the test corpus. The prototype was extended to handle more analysis
paths and reduce false positives. The aim was to make the performance
comparison with bugprone fairer by bringing the work done by the two
checks closer, within CIR’s coverage limits. I measure execution time
and review distinct use-after-move warning sites as one measure of
diagnostic quality.
I first describe the CIR lifetime checker and its use-after-move analysis. I then explain the comparison framework and present the performance results and the review of false positives.
Use-after-move detection with CIR
The clang-tidy check bugprone-use-after-move
uses Clang’s control-flow graph (CFG) to find uses of an object after a
move and account for reinitialization. This analysis can become
expensive on large, complex C++ projects.
CIR gives the analysis an explicit representation of operations, data flow, and lifetime scopes, including where storage is allocated and where object lifetimes end. This provides a basis for tracking program state. To interpret C++ operations correctly, the analysis also needs information from Clang’s AST - for example, whether a type is a smart pointer and which constructor has been selected. CIR combines these sources of information, allowing the checker to follow state changes through the IR and interpret them using facts preserved from the AST.
Figure 1 shows how the checker connects Clang’s AST, CIR, and lifetime diagnostics. The clang-tidy integration reuses its parsed AST to build CIR with explicit control flow, data flow, and lifetime boundaries, together with C++ facts about ownership, moves, and library contracts.
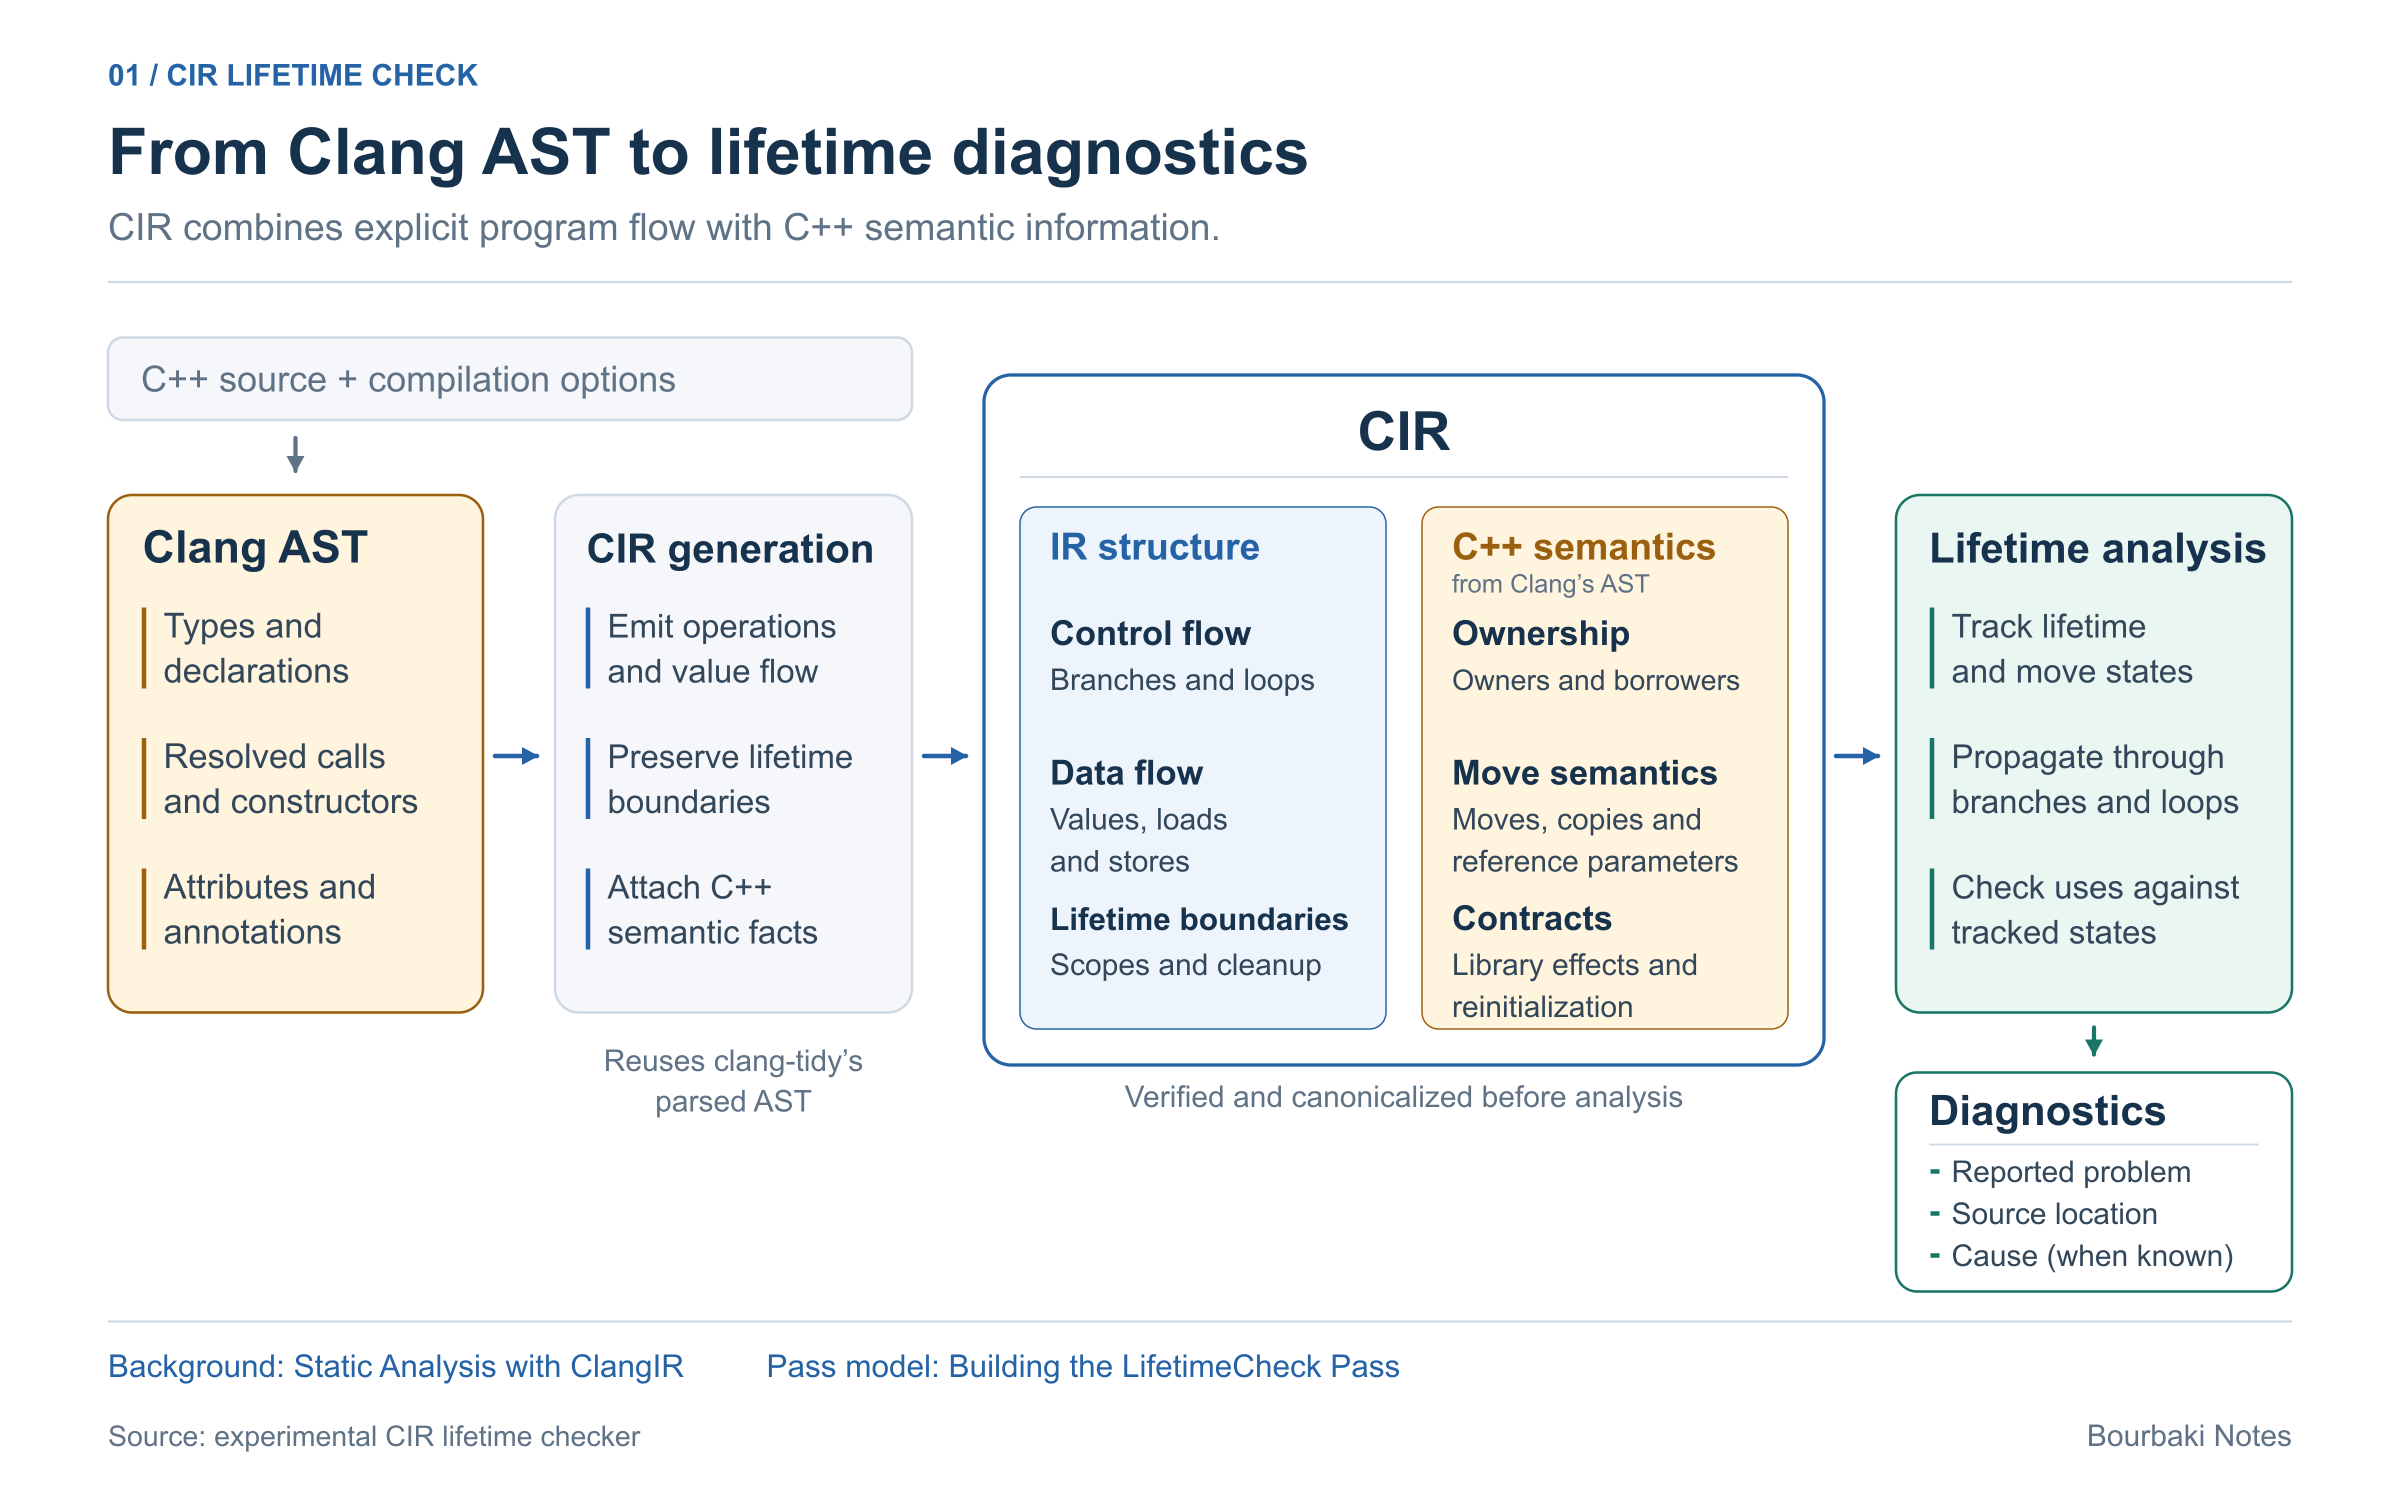
The analysis tracks lifetime and move states through branches and loops and reports potentially invalid uses with source locations and, when known, the preceding move or invalidation. For more detail on the underlying approach, see the earlier articles Building the LifetimeCheck Pass and AST Semantics and Use-After-Move Detection.
Consider the std::unique_ptr example in Figure 2. CIR generation preserves
AST-derived facts about the owner type, selected move constructor, and
operator* in CIR attributes.
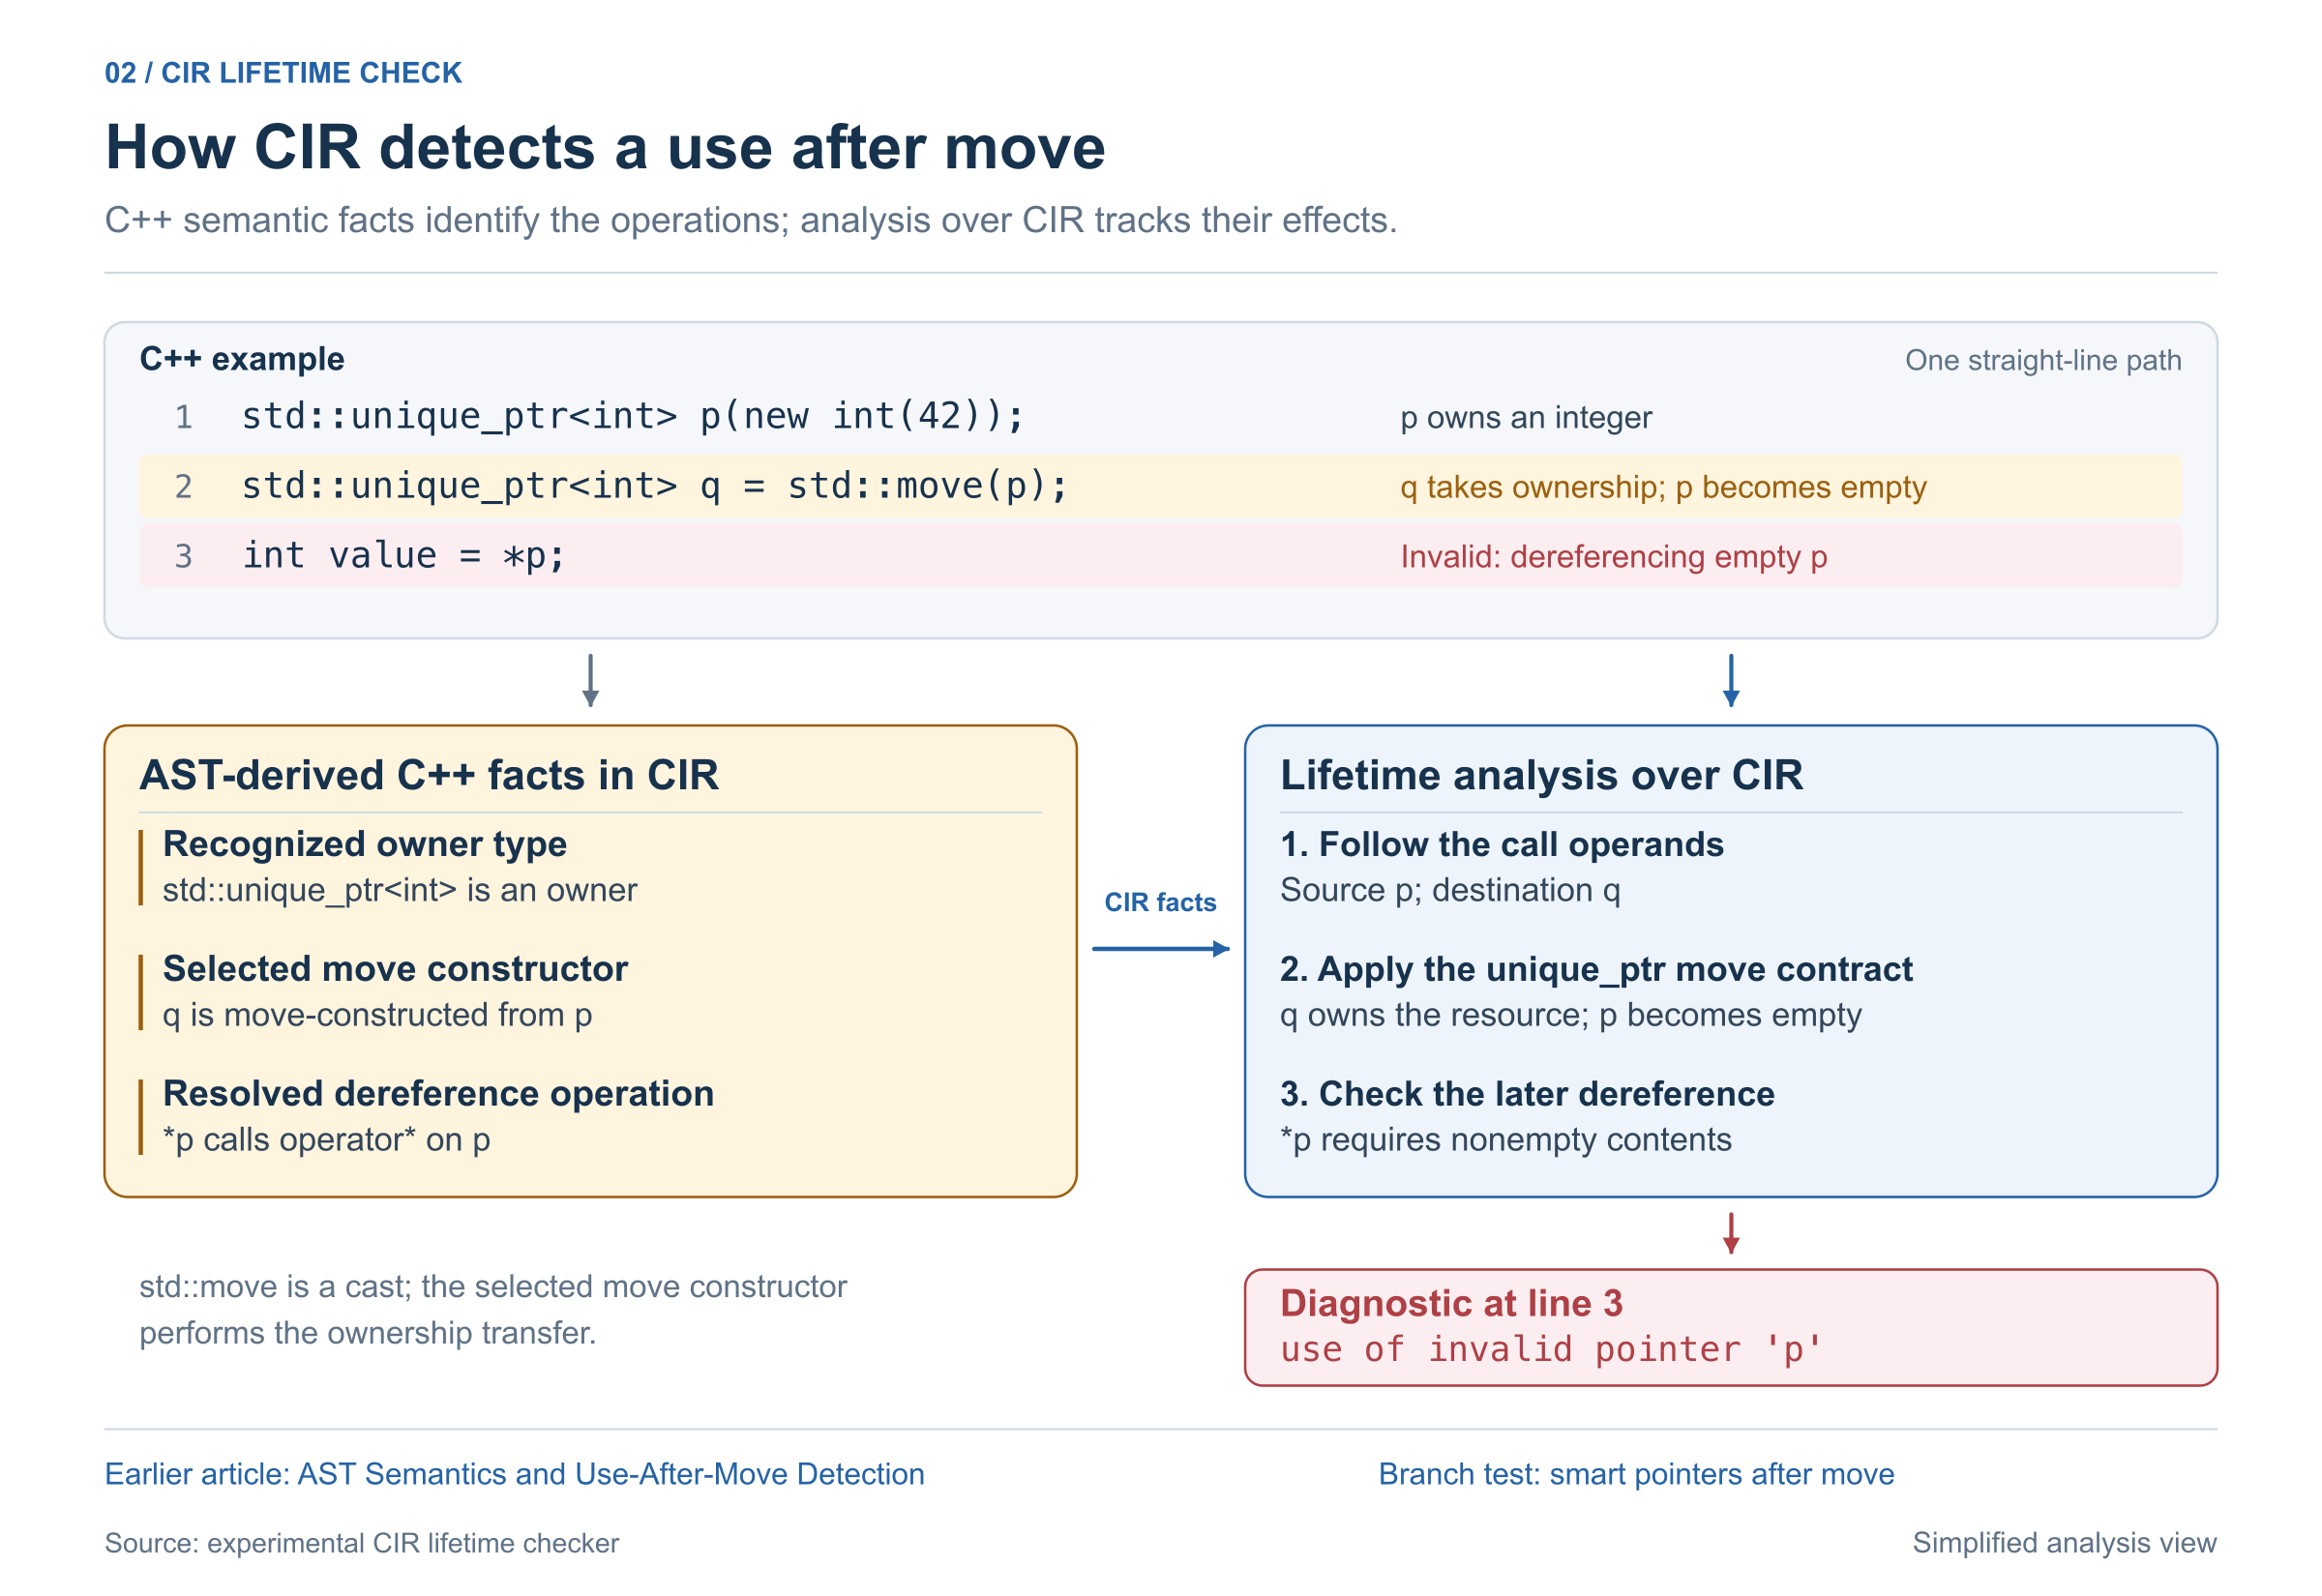
Using CIR’s call operands and execution flow, the lifetime analysis
applies the recognized move
contract: q takes ownership and p becomes
empty. The later *p then violates the dereference
precondition, so the checker reports an invalid use of p.
std::move
casts its argument to an rvalue reference; the selected move
constructor performs the ownership transfer.
This overview shows how the CIR lifetime checker combines CIR
operations with C++ facts from the AST. By tracking program state
directly over CIR, it avoids the repeated CFG construction and
move-specific searches performed by
bugprone-use-after-move. In the next section, we compare
the performance of the CIR lifetime checker and clang-tidy’s
bugprone-use-after-move on the Clang source tree.
Comparison with bugprone-use-after-move
Test corpus and configuration
For the tests, I used a fixed snapshot of the Clang source tree. The built-in profiler measurements used the checker from that snapshot. The independent phase measurements used an updated profiling build, with the same checker implementation and Clang corpus.
The frozen compilation database contained 1,614 translation units (TUs). The comparison uses the 1,572 C++ TUs that both checks completed successfully. CIR generation failed for three inputs, and the lifetime pass rejected another 37. These inputs and the two C inputs remain listed separately in the experiment records. None of the invocations crashed or timed out.
Both checks used the same clang-tidy binary, built in
Release mode with assertions disabled, and the compilation flags from
the frozen database. For each check and TU, I used one warmup followed
by three measured runs, with a 600-second limit per invocation.
The two profilers were run separately on this fixed corpus. The
built-in profiler measurements processed one check at a time, with four
clang-tidy processes running in parallel. The runner
alternated the order of the two checks between repetitions. The
independent profiler used serial paired invocations, alternating check
order. CIR itself used one analysis thread throughout.
The following commands show an unprofiled invocation of each check
for one TU. Here, $TIDY is the path to
clang-tidy, $DB is the compilation database
directory, $TU is the source file, and $OUT is
the output directory.
CIR lifetime check
"$TIDY" -p="$DB" \
  --checks='-*,cir-lifetime-check' \
  --config='{CheckOptions: {
    cir-lifetime-check.AnalyzeUnusedMainFileFunctions: true,
    cir-lifetime-check.HistLimit: 1,
    cir-lifetime-check.HistoryList: all,
    cir-lifetime-check.NumThreads: 1,
    cir-lifetime-check.RemarksList: ""
  },
    HeaderFilterRegex: ".*",
    SystemHeaders: false,
    WarningsAsErrors: ""}' \
  --warnings-as-errors= --use-color=false --quiet \
  --export-fixes="$OUT/cir/diagnostics.yaml" "$TU"
Bugprone use-after-move check
"$TIDY" -p="$DB" \
  --checks='-*,bugprone-use-after-move' \
  --config='{CheckOptions: {
    bugprone-use-after-move.InvalidationFunctions: "",
    bugprone-use-after-move.ReinitializationFunctions: ""
  },
    HeaderFilterRegex: ".*",
    SystemHeaders: false,
    WarningsAsErrors: ""}' \
  --warnings-as-errors= --use-color=false --quiet \
  --export-fixes="$OUT/bugprone/diagnostics.yaml" "$TU"
Built-in clang-tidy profiler
I first used clang-tidy’s built-in profiler with
--enable-check-profile and
--store-check-profile=<directory>.
Table 1 shows the wall time recorded within each check’s timer interval, summed across the common TUs and all three measured runs.
| Recorded check interval | Bugprone (s) | CIR (s) |
|---|---|---|
| Wall time | 3,588.19 | 760.17 |
The recorded interval is \(4.72\times\) smaller for CIR, including CIR generation and the subsequent passes. However, the built-in profiler adds different overhead to the two checks. It starts and stops timers during AST matching, so bugprone’s statement matcher pays this cost much more often than CIR’s translation-unit matcher.
With built-in profiling enabled, bugprone’s whole-invocation total was about 34% higher than in the unprofiled measurements on the same Clang snapshot, while CIR’s total was almost unchanged. These measurements were collected in separate runs, so the difference cannot be attributed solely to profiling. The recorded check intervals include the unequal instrumentation costs.
To avoid this bias, I implemented an independent phase profiler. It records four timestamps per translation unit, regardless of how many AST nodes the check visits. The following comparison uses this profiler with clang-tidy’s built-in profiling disabled.
Independent phase profiler
The benchmark
runner collected the independent phase measurements using the serial
paired configuration described above. The profiling
protocol uses --store-phase-profile=<directory>
without enabling the built-in check timers.
Table 2 adds the times across the common translation units and all three measured runs. Each whole invocation includes startup, frontend processing, analysis, diagnostic output, shutdown, and the measurement supervisor.
| Recorded interval | Bugprone (s) | CIR (s) |
|---|---|---|
| Consumer setup | 2.179 | 2.117 |
| Frontend before analysis | 6,759.134 | 6,768.282 |
| Analysis after parsing | 1,983.137 | 907.087 |
| Process residual | 471.834 | 352.465 |
| Whole invocation | 9,216.285 | 8,029.950 |
Across all measured invocations, CIR took 12.87% less overall time. CIR’s analysis after parsing was \(2.19\times\) faster. This interval includes matcher traversal, dispatch, and diagnostics. For CIR, it also includes generation, verification, passes, and context teardown.
Frontend processing took nearly the same time for both checks. Analysis accounted for 21.52% of bugprone’s invocation time and 11.30% of CIR’s, which helps explain why the overall improvement was smaller. The frontend interval includes parsing and semantic analysis. The process residual includes startup, AST teardown, diagnostic export, profile serialization, and the measurement supervisor.
Before the full run, I compared profiling enabled and disabled on a separate frozen 100-TU sample. For both checks, the 95% confidence interval for the change in whole-invocation time stayed within \(\pm1\%\).
A separate detailed run on the same frozen 100-TU sample measured the work inside CIR’s analysis interval. Table 3 adds the times across three repetitions for the 98 TUs that CIR completed successfully. The detailed CIR stage timers were enabled for this separate run.
| Work inside CIR’s analysis interval | Time (s) |
|---|---|
| CIR generation | 25.711 |
| Explicit verification | 1.412 |
| Canonicalization, including pass verification | 1.631 |
| Lifetime pass, including pass verification | 8.314 |
| Remaining analysis time | 11.016 |
Generating CIR took just over half of the analysis interval in this sample.
Diagnostic quality and analysis scope
We can compare diagnostic quality by looking at the use-after-move warnings produced by both checks. A warning in a shared header can appear in several TUs, so each source location is counted once. Table 4 combines false positives and policy warnings on valid code, with the move-semantics tests listed separately.
| Reviewed use-after-move source sites | Bugprone | CIR |
|---|---|---|
| Warnings on valid code, excluding move-semantics tests | 16 | 7 |
| Warnings in move-semantics tests | 2 | 3 |
| Confirmed naturally occurring production defects | 0 | 0 |
| Total distinct sites | 18 | 10 |
Some of the warnings in Table 4 come
from test code. For example, consider ValueMoveSemantics in
the Interpreter
tests. It moves a Value object and then checks that the
source is empty. Bugprone warns at the first check, while CIR also warns
at a later check after the same move. These are valid operations that
inspect the expected state of the moved-from object.
Bugprone searches the AST, including move-related calls in unused inline functions in headers. CIR analyzes functions emitted by CIR generation. To cover more cases, the experiment also enables analysis of selected unused non-template inline functions in the main source file. CIR follows the emitted evaluation order, so it can miss an invalid use that occurs under another order allowed by C++.
Some false-positive fixes came from this same Clang corpus while extending the prototype for the performance comparison. The counts therefore apply to code also used during development. We have not measured how many bugs either check misses.
It’s worth noting that CIR also checks for null or uninitialized pointer dereferences, uses of dangling pointers, and selected coroutine lifetime errors. We do not review those warnings here, but the time spent on these checks is included in the measurements.
Conclusion
In this article, I explored use-after-move detection with CIR and compared it with clang-tidy’s implementation based on Clang’s CFG. The independent profiler measured CIR’s analysis after parsing as \(2.19\times\) faster, including CIR generation and passes. Frontend processing remained nearly unchanged, limiting the whole-invocation improvement to 12.87%. CIR reported fewer use-after-move warning sites on the reviewed Clang corpus, although the checks analyze different sets of functions.
Discussion
Register with a username and password to join the discussion.